

Introduction
Inventory turnover is a vital metric for businesses aiming to optimize operations, reduce costs, and improve profitability. It shows how well a company manages its inventory. It calculates the frequency of stock sales and replacements in a year. Understanding and leveraging the inventory turnover formula can reveal insights into sales performance, inventory management, and overall business health.
In this comprehensive guide, we’ll explore inventory turnover, its calculation, practical examples, interpretation of the results, and actionable strategies for improving it. Whether you’re running a retail store, a manufacturing company, or a logistics operation, mastering inventory turnover can streamline processes, free up capital, and enhance customer satisfaction.
What is Inventory Turnover?
Definition and Overview
Inventory turnover is a financial ratio that indicates how many times a company’s inventory is sold and replenished within a specific timeframe. The calculation involves dividing the cost of goods sold (COGS) by the average value of inventory. This key performance indicator (KPI) shows how well a business manages its stock levels. It helps meet customer demand without overstocking, which can tie up money, or understocking, which can lead to lost sales.
Inventory turnover varies significantly across industries. For example, a grocery store that sells perishable goods usually has a high turnover rate. In contrast, a luxury goods store with expensive, slow-moving items may have a lower rate. Understanding your industry’s benchmarks is crucial for evaluating your performance.
Significance in Business Operations
Inventory turnover is more than just a number, it’s a window into your business’s operational efficiency. A high turnover rate often signals strong sales, effective inventory management, and responsiveness to market demand. Conversely, a low turnover rate may indicate overstocking, weak sales, or misaligned purchasing strategies, leading to increased holding costs, spoilage, or obsolescence.
By monitoring inventory turnover, businesses can:
- Optimize Cash Flow: Faster turnover frees up capital tied in inventory, allowing reinvestment in growth opportunities.
- Reduce Holding Costs: Lower inventory levels decrease storage, insurance, and obsolescence costs.
- Improve Customer Satisfaction: Efficient inventory management ensures products are available when customers need them, avoiding stockouts.
- Inform Strategic Decisions: Turnover data guides purchasing, pricing, and production strategies, aligning operations with market demand.
Calculating Inventory Turnover
Inventory Turnover Formula
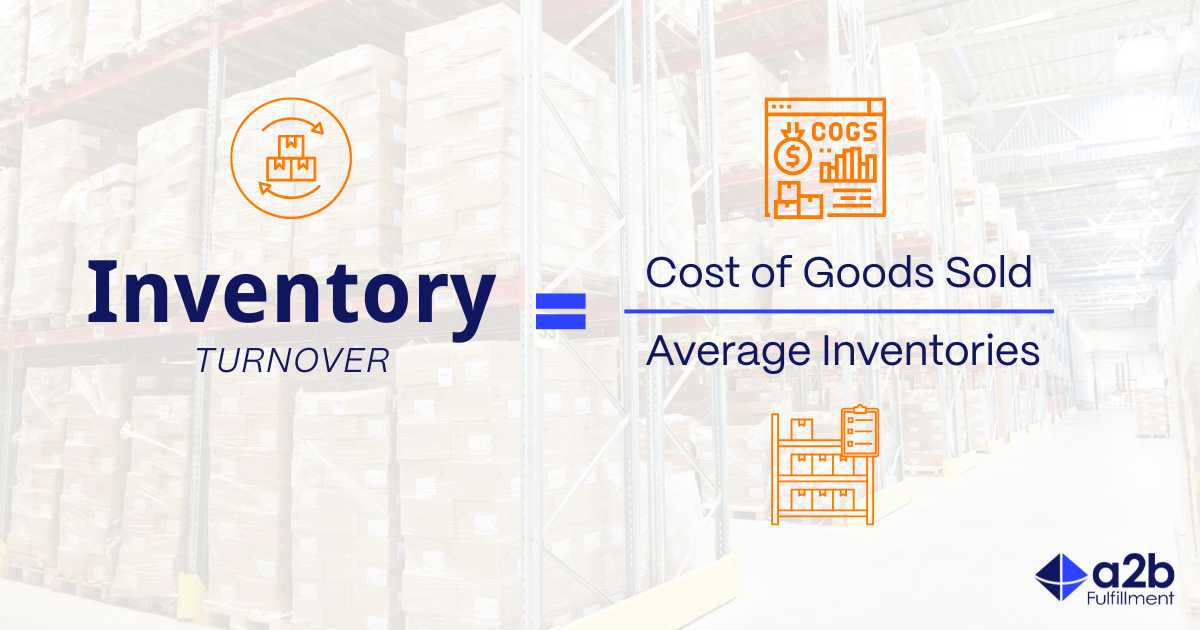
The inventory turnover formula is simple yet powerful:
Inventory Turnover = Cost of Goods Sold (COGS) ÷ Average Inventory
This formula measures how many times inventory is “turned over” or sold during a period, typically a year. A higher ratio indicates efficient inventory use, while a lower ratio may suggest inefficiencies.
Using Cost of Goods Sold (COGS)
COGS refers to the direct expenses incurred in manufacturing or acquiring goods sold in a timeframe. It includes expenses like raw materials, direct labor, and manufacturing overhead, excluding indirect costs like marketing, administrative expenses, or distribution. COGS can be found on an income statement, making it readily accessible for most businesses.
For example, a retailer purchasing products for resale would include the wholesale cost of goods in COGS. In contrast, a manufacturer would include costs like raw materials and labor used in production. Accurate COGS calculation is essential for reliable inventory turnover results.
Determining Average Inventory
Average inventory accounts for fluctuations in stock levels over time, providing a more accurate picture than a single snapshot. It’s calculated as:
Average Inventory = (Beginning Inventory + Ending Inventory) ÷ 2
You can typically find beginning and ending inventory values on your balance sheet for your analyzing period. For businesses with significant seasonal variations, you may calculate average inventory over shorter periods (e.g., monthly or quarterly) to capture more granular trends.
To ensure accuracy:
- Use consistent time periods for COGS and average inventory (e.g., both annual or both quarterly).
- Verify inventory values to account for discrepancies like damaged goods or returns.
- Consider using inventory management software for real-time tracking and precise calculations.
Practical Examples of Inventory Turnover Calculations
Example 1: Retail Business

Consider a retail clothing store with the following data fora year:
COGS: $500,000
Beginning Inventory: $100,000
Ending Inventory: $80,000
Calculate Average Inventory:
Average Inventory = ($100,000 + $80,000) ÷ 2 = $90,000
Apply the Inventory Turnover Formula:
Inventory Turnover = $500,000 ÷ $90,000 ≈ 5.56
This means the store turned over its inventory approximately 5.56 times during the year. To convert this into days, divide 365 by the turnover ratio:
Days to Sell of Inventory (DSI) = 365 ÷ 5.56 ≈ 66 days
On average, the store takes about 66 days to sell its entire inventory. It suggests efficient inventory management if this is faster than the industry average for clothing retailers (e.g., 4–5 times per year).
Example 2: Manufacturing Company
Now, let’s look at a manufacturing company producing industrial equipment:
COGS: $2,000,000
Beginning Inventory: $400,000
Ending Inventory: $600,000
Calculate Average Inventory:
Average Inventory = ($400,000 + $600,000) ÷ 2 = $500,000
Apply the Inventory Turnover Formula:
Inventory Turnover = $2,000,000 ÷ $500,000 = 4
This indicates the manufacturer turned over its inventory 4 times in the year, or approximately every 91 days (365 ÷ 4). This may be reasonable for a manufacturer dealing with high-value equipment, but comparing it to industry benchmarks (e.g., 3–5 times for similar manufacturers) will provide context.
Example 3: Seasonal Business

Consider a seasonal business, such as a holiday decor retailer, with significant inventory fluctuations:
COGS: $300,000 (for the holiday season, October–December)
Beginning Inventory (October 1): $150,000
Ending Inventory (December 31): $50,000
Calculate Average Inventory:
Average Inventory = ($150,000 + $50,000) ÷ 2 = $100,000
Apply the Inventory Turnover Formula:
Inventory Turnover = $300,000 ÷ $100,000 = 3
For a three-month period, the retailer turned over its inventory 3 times, or roughly once per month (90 ÷ 3 = 30 days). This high turnover is expected for seasonal businesses with concentrated sales periods.
Interpreting Inventory Turnover Ratios
High Inventory Turnover Explained
A high inventory turnover ratio typically indicates:
- Strong Sales: Products are moving quickly, reflecting high customer demand.
- Efficient Inventory Management: Stock levels are well-aligned with sales, minimizing excess inventory.
- Lean Operations: Businesses avoid overstocking, reducing storage and obsolescence costs.
For example, a grocery store might have a turnover ratio of 12–15, reflecting frequent restocking of perishable goods. However, excessively high turnover could signal understocking, leading to stockouts, lost sales, or customer dissatisfaction. Businesses must balance turnover with availability to meet demand.
Low Inventory Turnover Explained
A low inventory turnover ratio may indicate:
- Overstocking: Excess inventory ties up capital and increases holding costs.
- Slow-Moving Products: Products may be outdated, unpopular, or poorly marketed.
- Inaccurate Forecasting: Misaligned purchasing decisions lead to stock mismatches.
For instance, a luxury watch retailer might have a turnover ratio of 1–2 due to high-value, slow-selling items. While this is normal for the industry, a ratio significantly below the benchmark could signal issues like overstocking or weak demand. Low turnover increases risks like obsolescence, spoilage (for perishables), or markdowns to clear inventory.
Industry Benchmarks
Interpreting turnover ratios requires context. Industry benchmarks vary widely:
- Grocery Stores: 12–18 turnovers per year (high demand, perishables).
- Clothing Retail: 4–6 turnovers per year (seasonal trends, fashion cycles).
- Manufacturing (Heavy Equipment): 2-4 turnovers per year (high-value, long production cycles).
- Luxury Goods: 1-3 turnovers per year (exclusive, slow-moving items).
Compare your ratio to industry standards to assess performance. Tools like industry reports or financial platforms can provide benchmark data.
Strategies for Improving Inventory Turnover
Enhancing Inventory Management
Effective inventory management is the cornerstone of improving turnover. Key tactics include:
- Just-in-Time (JIT) Inventory: Order stock as needed to reduce excess inventory and holding costs. JIT requires reliable suppliers and precise forecasting.
- ABC Analysis: Categorize inventory into A (high-value, low-quantity), B (moderate-value, moderate-quantity), and C (low-value, high-quantity) items. Focus on optimizing high-value A items to improve turnover.
- Inventory Management Software: Use tools like NetSuite, Zoho Inventory, or a2b Fulfillment’s proprietary systems to track stock levels, monitor turnover, and identify slow-moving items for promotions or markdowns.
- Regular Audits: Conduct physical inventory counts to ensure data accuracy, reducing discrepancies that skew turnover calculations.
For example, a retailer might use software to identify that 20% of its SKUs account for 80% of sales (Pareto Principle). By focusing on high-performing items and reducing slow-movers, turnover improves.
Streamlining Supply Chain Processes
An efficient supply chain accelerates inventory movement from supplier to customer. Strategies include:
- Supplier Relationships: Build partnerships with reliable suppliers to negotiate shorter lead times and flexible order quantities.
- Optimized Logistics: Partner with third-party logistics (3PL) providers like a2b Fulfillment to streamline warehousing, picking, packing, and shipping processes.
- Cross-Docking: Reduce storage time by transferring goods directly from inbound to outbound trucks, ideal for high-turnover industries like retail.
- Automation: Implement automated systems for order processing and inventory tracking to reduce delays and errors.
For example, a2b Fulfillment’s warehousing solutions can cut lead times by placing inventory closer to customers, which helps e-commerce businesses improve their turnover.
Improving Demand Forecasting

Accurate demand forecasting aligns inventory with customer needs, preventing overstocking or stockouts. Key approaches include:
- Historical Data Analysis: Use past sales data to identify trends, seasonality, and demand patterns. For example, a retailer might notice a spike in winter clothing sales from November to January.
- Market Trend Monitoring: Stay informed about industry trends, consumer preferences, and economic factors. For instance, a sudden shift to eco-friendly products might require adjusting inventory.
- Advanced Analytics: Leverage machine learning tools or forecasting software to predict demand with greater accuracy, especially for businesses with complex product lines.
- Collaborative Forecasting: Work with suppliers and customers to share demand insights, improving alignment across the supply chain.
A manufacturer might use forecasting to reduce production of slow-moving items, reallocating resources to high-demand products, thus boosting turnover.
Additional Strategies
- Promotions and Discounts: Clear slow-moving inventory through targeted promotions, flash sales, or bundling with popular items.
- Product Line Optimization: Discontinue low-performing SKUs and focus on high-demand products to streamline inventory.
- Seasonal Planning: Adjust inventory levels for peak seasons, ensuring sufficient stock without overordering.
- Customer Feedback: Use surveys or reviews to understand demand drivers, helping refine inventory decisions.
Conclusion
The inventory turnover formula is a powerful tool for assessing and enhancing business efficiency. By calculating your turnover ratio and comparing it to industry benchmarks, you can identify strengths and weaknesses in your inventory management. High turnover reflects strong sales and lean operations, while low turnover highlights opportunities for improvement.
Businesses can boost turnover, reduce costs, and improve profitability by implementing just-in-time inventory, streamlined supply chains, accurate demand forecasting, and optimized product lines. Regular monitoring and data-driven decisions are key to maintaining a healthy turnover rate.
Partnering with experts like a2b Fulfillment can further enhance your inventory management and supply chain efficiency. Their tailored solutions help businesses of all sizes achieve faster turnover, lower costs, and better customer satisfaction. Start optimizing your inventory today to unlock your business’s full potential.
How can a2b help

Ready to transform your inventory management and skyrocket your turnover? Let us help you streamline your operations and cut costs. Visit a2bfulfillment.com to explore our warehousing, logistics, and fulfillment solutions. Contact us to schedule a consultation and take the first step toward operational excellence!
FAQs
What is a good inventory turnover ratio?
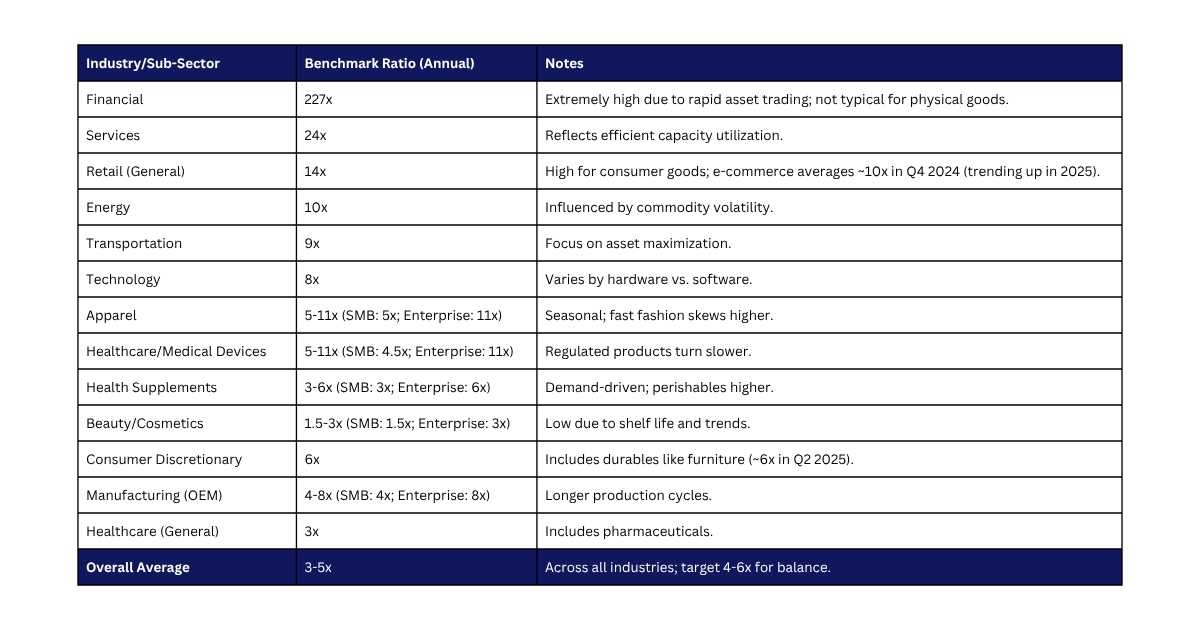
There is no single "good" inventory turnover ratio that applies universally, as the optimal level depends heavily on your industry, business size, product type, and market conditions. Higher ratios generally indicate efficient inventory management, meaning stock sells quickly, minimizing holding costs and capital tied up in unsold goods, while lower ratios may signal overstocking, slow sales, or obsolescence risks. A common general benchmark is 4-6 times per year, which balances sales velocity with the risk of stockouts (running out of inventory). However, ratios above 8-10 can be excellent for fast-moving sectors like retail or e-commerce, whereas 2-4 might be acceptable (or even ideal) for industries with longer sales cycles, like luxury goods or pharmaceuticals.
To determine what's "good" for your business, compare your calculated ratio (COGS ÷ average inventory) against industry-specific benchmarks. Below is a summary of 2025 benchmarks, drawn from recent financial data. These are medians or averages; aim to meet or exceed them for your company size and sub-sector.
How to calculate inventory turnover ratio?
The inventory turnover ratio is computed by dividing the Cost of Goods Sold (COGS) by the average inventory. To determine the average inventory, refer to the balance sheet: take the starting inventory from one period and the ending inventory from the next, sum them, and divide by 2. Next, pull the COGS figure from the income statement for that timeframe, then divide it by the average inventory to get the ratio.
What does inventory turnover ratio tell you?
The inventory turnover ratio is a key financial metric that reveals how efficiently a company manages its inventory by showing how many times the average inventory is sold and replaced over a specific period, typically a year. It provides insights into sales velocity, operational efficiency, and potential cash flow issues.
Key Insights It Provides
- Sales Speed and Demand: A higher ratio (e.g., 8+ times) indicates fast-moving inventory, strong demand, and effective marketing, meaning products sell quickly without excess stock tying up capital. Conversely, a low ratio (e.g., under 2) signals slow sales, overstocking, or obsolescence risks, which can lead to higher holding costs or losses from spoiled/unsold goods.
- Inventory Management Efficiency: It highlights whether inventory levels align with sales, aim for a balanced ratio like 4-6 to avoid stockouts (too high) or waste (too low). This helps optimize purchasing, reduce storage expenses, and improve liquidity.
- Business Health Signals: Beyond basics, it can pinpoint marketing effectiveness or marketability of specific products, and even areas of financial leakage (e.g., poor forecasting).