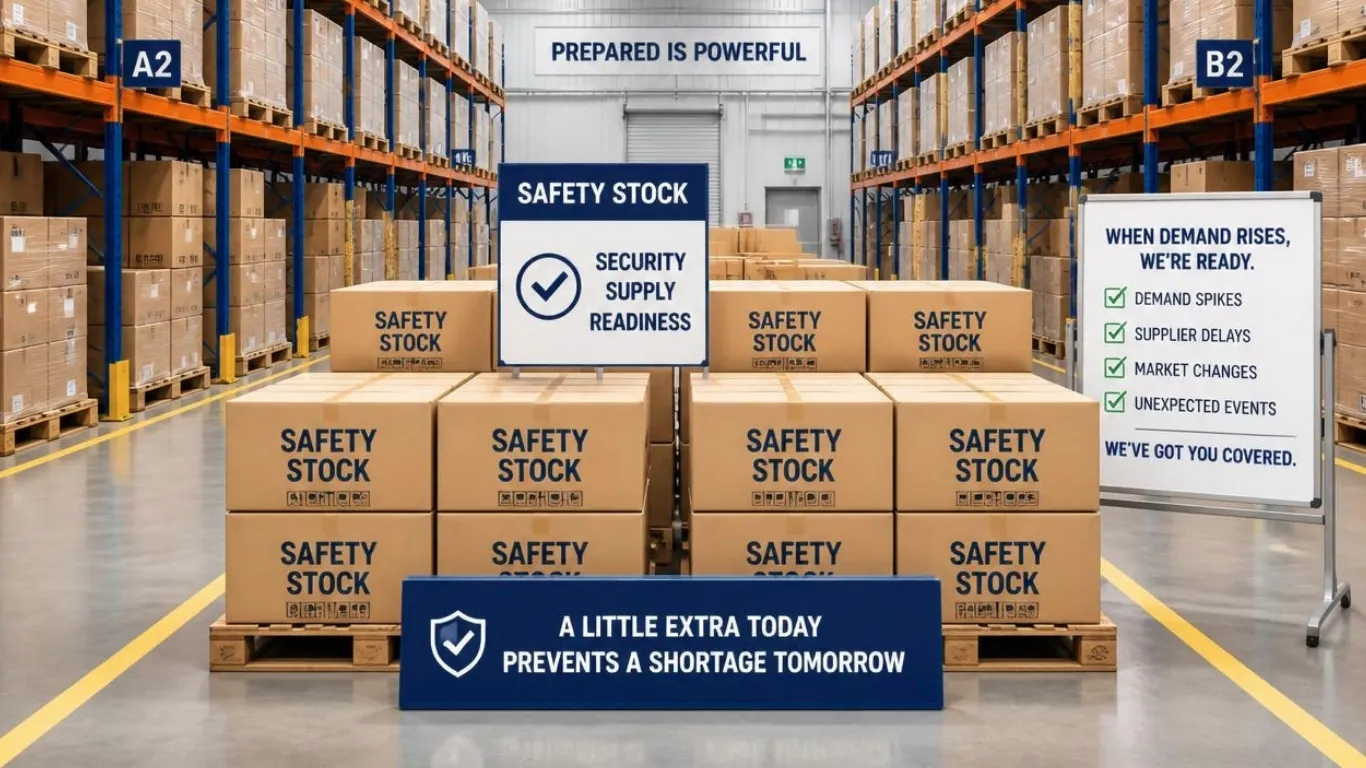


Stockouts can happen even when inventory planning appears to be on track. Demand can spike unexpectedly, suppliers can miss delivery dates, inbound freight can be delayed, or a promotion can perform better than forecast. Without enough inventory available to absorb those fluctuations, businesses risk lost sales, backorders, higher costs, and disappointed customers.
That is where safety stock comes in.
A safety stock calculation helps determine how much additional inventory to keep on hand beyond what you expect to sell during a normal replenishment cycle. The goal isn't simply to carry more inventory. It's to establish the right buffer based on actual demand, supplier lead times, variability, and the level of service you want to provide.
Safety stock protects against unexpected changes in demand and replenishment time. A commonly used safety stock formula is:
Safety Stock = (Maximum Daily Sales × Maximum Lead Time) − (Average Daily Sales × Average Lead Time)
Once calculated, safety stock can be incorporated into your reorder point so replenishment occurs early enough to reduce the risk of a stockout.
Table of Contents
- What Is Safety Stock?
- Why Stockouts Are Costly
- Safety Stock Calculation Methods
- Key Variables in Your Formula
- How to Apply Safety Stock in Practice
- Common Mistakes to Avoid
- Better Inventory Decisions Start With Better Visibility
- Frequently Asked Questions
What Is Safety Stock?
Safety stock is additional inventory held to protect a business against uncertainty in demand or replenishment.
Consider a product that normally sells 50 units per day and takes 10 days to replenish. Based on averages alone, you might assume 500 units will cover demand while waiting for the next shipment.
But averages don't account for variability.
What happens if sales increase to 70 units per day? What if the supplier takes 13 days instead of 10? What if both happen at once?
Safety stock provides a buffer to help cover those situations.
It is important to distinguish safety stock from two related inventory concepts:
Cycle stock is the inventory a business expects to consume during its normal replenishment cycle. If you order 1,000 units and expect to sell those units before the next replenishment arrives, those units are essentially cycle stock.
Safety stock is the additional inventory maintained to protect against uncertainty.
A reorder point is the inventory level that triggers replenishment. It generally incorporates both expected demand during lead time and safety stock.
Think of safety stock as insurance against variability, not inventory intended to support normal forecast demand.
Why Stockouts Are Costly
The most obvious consequence of a stockout is a lost sale. For an eCommerce brand, however, the total impact can be much greater.
When a customer arrives ready to purchase and finds that an item is unavailable, the customer may buy a competing product instead. Repeated stockouts can gradually erode customer satisfaction and confidence in the brand.
Operational costs can increase as well.
A business trying to recover from a shortage may expedite inbound freight, pay suppliers for rush production, split shipments, upgrade outbound transportation, or devote additional labor to managing backorders and customer inquiries.
Stockouts can also create ripple effects throughout the supply chain. Promotions may need to be changed, fulfillment plans adjusted, purchase orders accelerated, and inventory reallocated between fulfillment centers.
The challenge is finding the right balance. Too little increases stockout risk, but too much safety stock ties up working capital and warehouse space and increases the risk of inventory becoming obsolete.
A good safety stock calculation attempts to find the appropriate middle ground.
Safety Stock Calculation Methods
There isn't one safety stock formula that is right for every business or every SKU. The appropriate method depends on the amount and quality of historical data available, the predictability of demand, supplier performance, and the desired service level.
Basic Safety Stock Formula
One practical method uses maximum and average demand along with maximum and average lead times:
Safety Stock = (Maximum Daily Sales × Maximum Lead Time) − (Average Daily Sales × Average Lead Time)
For example, assume a SKU has:
- Maximum daily sales: 80 units
- Maximum lead time: 14 days
- Average daily sales: 50 units
- Average lead time: 10 days
The calculation would be:
(80 × 14) − (50 × 10) = 620 units
In this example, the business would maintain approximately 620 units of safety stock.
The calculation creates a buffer between a higher-risk scenario—maximum observed demand combined with maximum lead time—and the inventory required under average conditions.
This method is relatively easy to understand and implement, making it useful for businesses that have reliable historical data but do not require sophisticated statistical modeling.
Advanced Safety Stock Formula
For businesses managing large SKU counts, significant seasonality, or more complex demand patterns, a statistical approach may provide better results.
An advanced safety stock calculation can incorporate:
- Demand variability
- Lead time variability
- Desired service level
- Standard deviation of demand
- Standard deviation of lead time
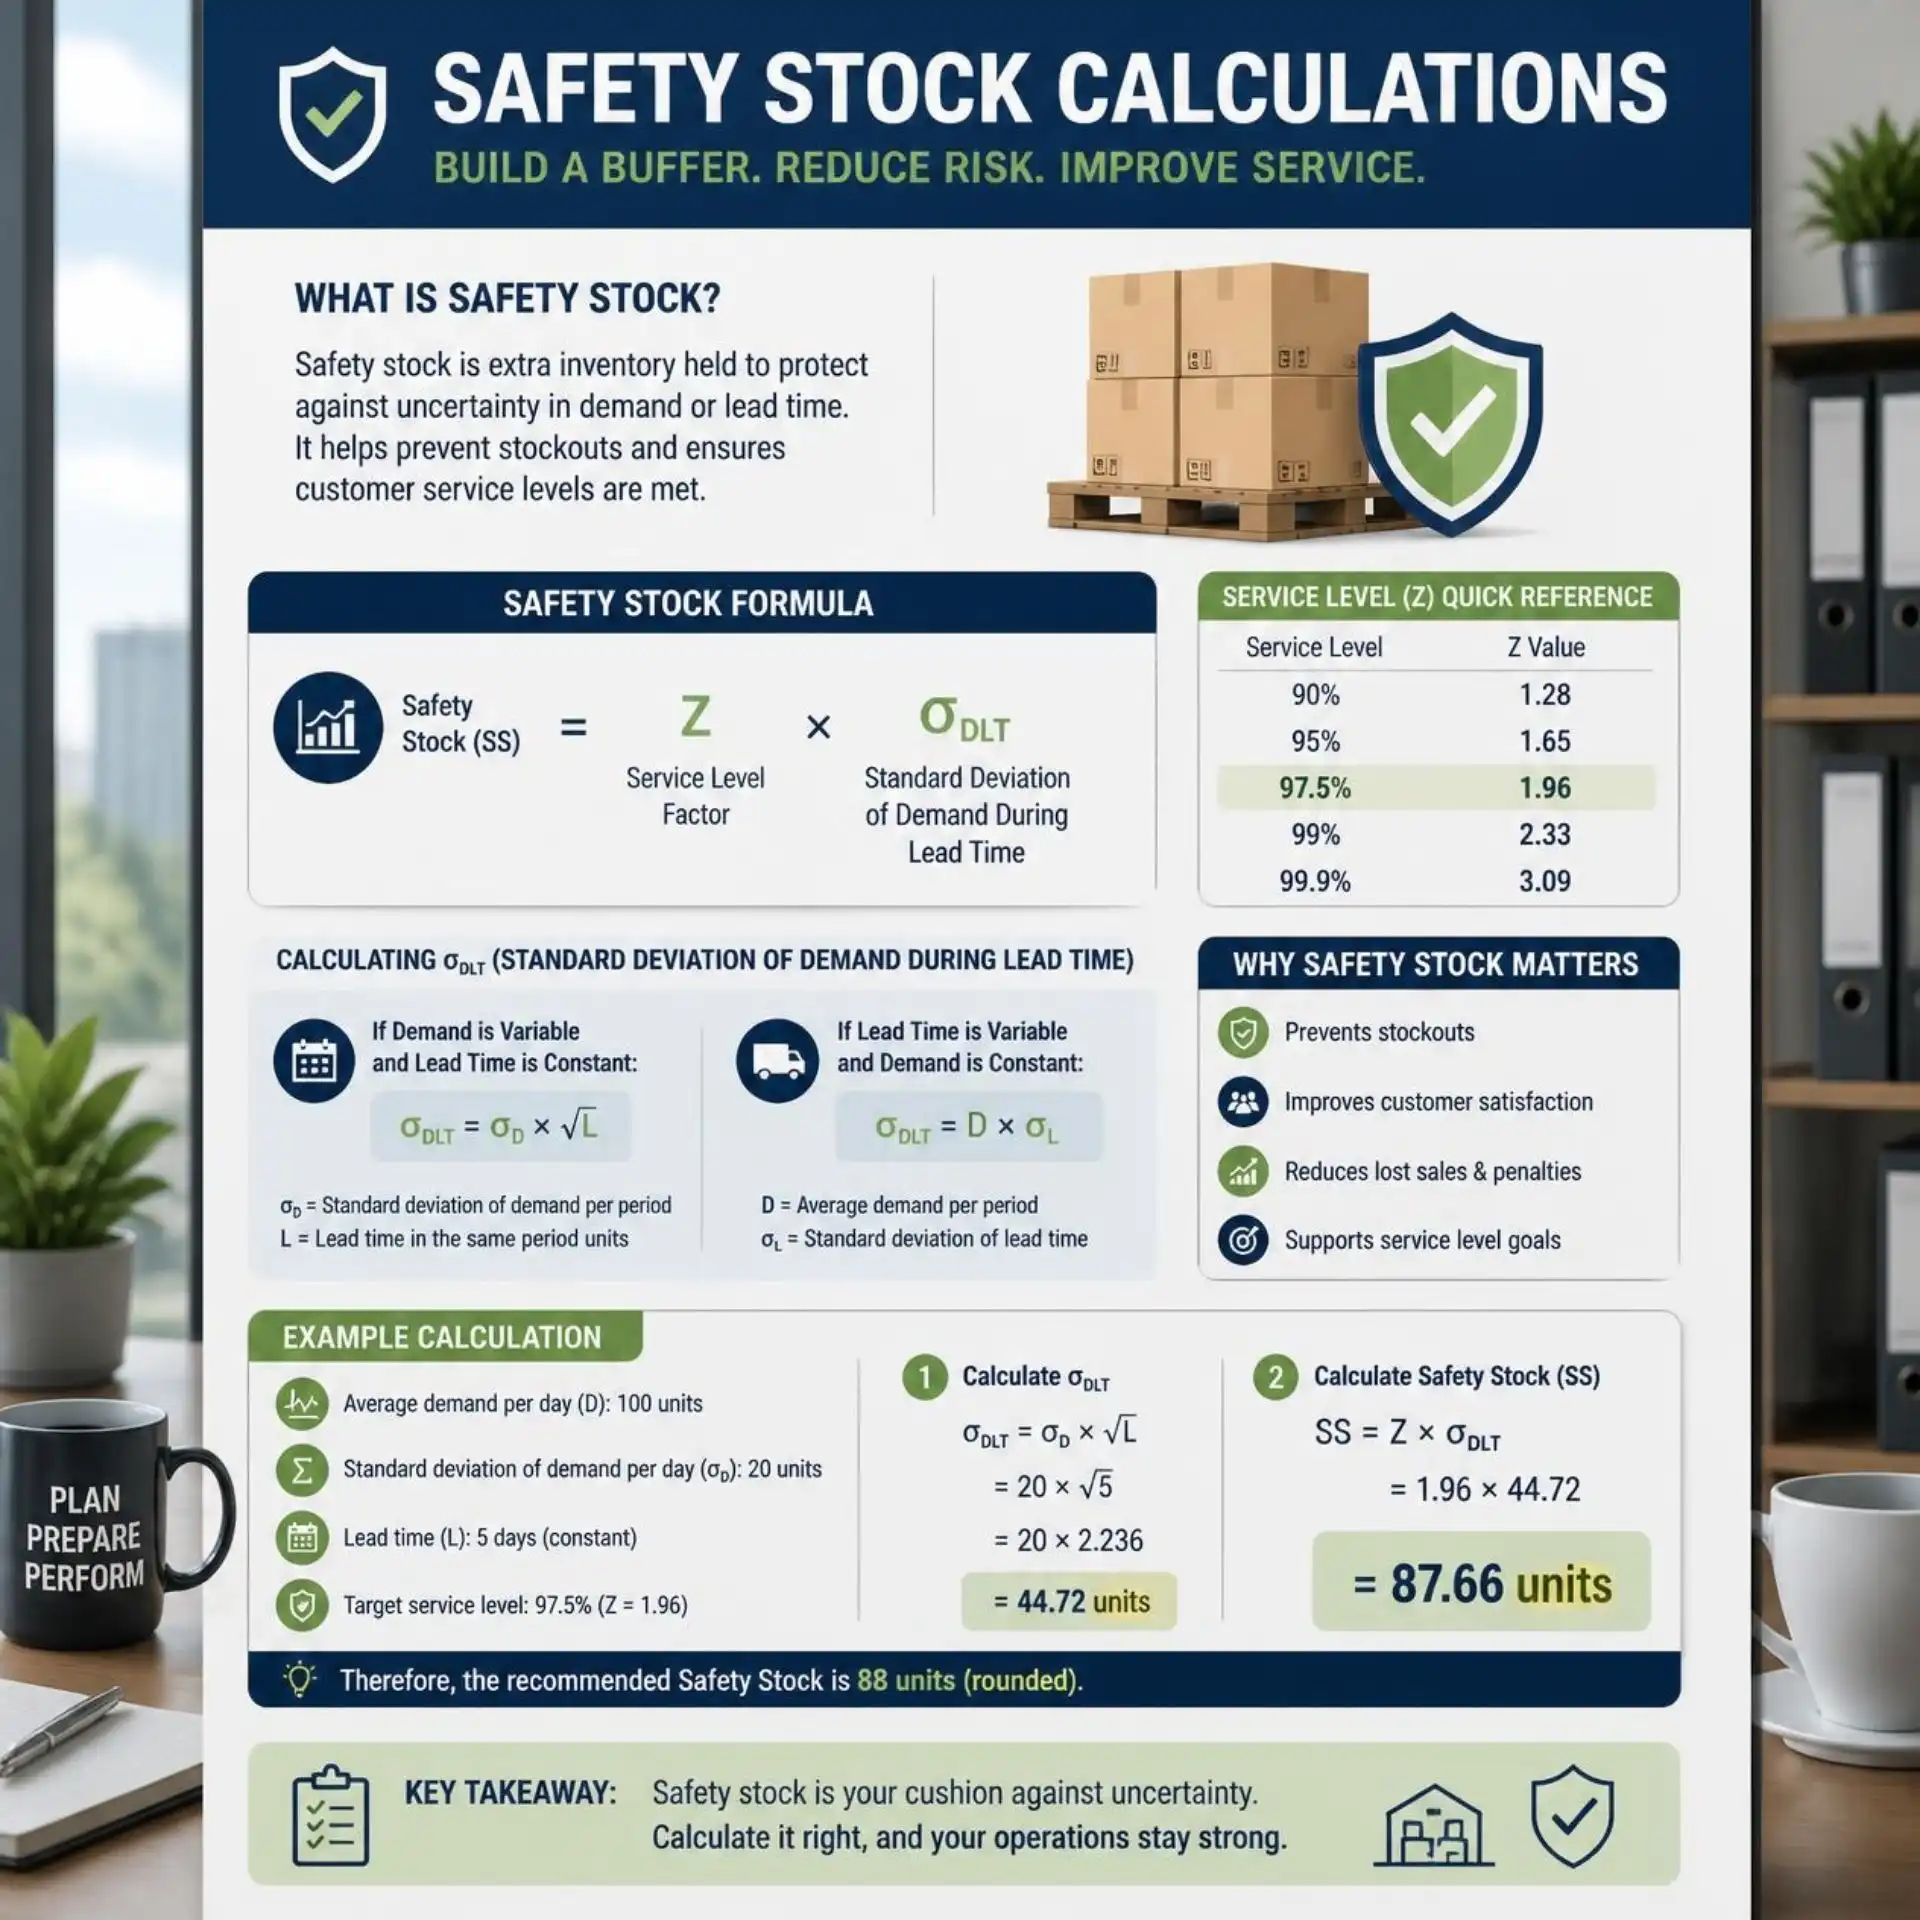
A common statistical approach uses a service-level z-score and the standard deviation of demand during lead time.
In a simplified situation where lead time is relatively consistent, the formula may be expressed as:
Safety Stock = Z × σd × √LT
Where:
- Z = service-level z-score
- σd = standard deviation of daily demand
- LT = average lead time
For example, a business targeting approximately a 95% cycle service level would commonly use a z-score of about 1.65.
When both demand and lead time fluctuate materially, a more comprehensive model can account for both sources of variability. This can be particularly useful for businesses with thousands of SKUs, long supplier lead times, seasonal products, or significant differences in supplier reliability.
The objective remains the same: carry enough buffer stock to achieve the desired level of availability without unnecessarily increasing inventory.
Key Variables in Your Safety Stock Formula
The accuracy of a safety stock calculation depends heavily on the quality of the inputs. A sophisticated formula built on poor data can produce worse results than a simple formula using accurate data.
Average and Maximum Daily Demand
Average demand represents typical unit sales over a defined period. Maximum daily demand captures unusually high usage and helps account for potential demand spikes.
Where practical, use at least 90 days of data rather than a short snapshot. However, the appropriate period depends on the product.
For seasonal SKUs, using the previous 90 days may actually distort the calculation. Historical data from comparable seasons, promotions, or sales cycles may provide a better representation of future demand.
Lead Time
Lead time should represent the actual amount of time required to replenish inventory at the warehouse or fulfillment center.
That can include supplier processing, production, transportation, customs clearance where applicable, receiving, and the time necessary for inventory to become available for fulfillment.
Using the supplier's quoted production time while ignoring transportation and receiving time can significantly underestimate replenishment requirements.
Both average lead time and maximum lead time matter. A supplier that averages 15 days but regularly fluctuates between 10 and 25 days creates a very different inventory risk than one that consistently delivers in 15 days.
Service Level
Your desired service level reflects how much stockout risk you are willing to accept.
Higher service levels generally require more safety stock. But targeting an extremely high service level for every SKU can result in excessive inventory.
A high-volume hero product may justify a higher service target than a slow-moving item with predictable demand. This is one reason safety stock policies should often be segmented by SKU characteristics rather than applied universally.
Demand Variability
Two products can have identical average sales and require very different safety stock levels.
A SKU that sells 50 units almost every day is highly predictable. Another might average 50 units but fluctuate between 10 and 120 units depending on the day.
The second SKU has greater demand variability and generally requires a larger buffer.
This is why averages alone don't tell the full story.
How to Apply Safety Stock in Practice
Calculating safety stock is only useful if the result becomes part of the day-to-day inventory management process.
Setting Reorder Points
Once you've determined safety stock, you can incorporate it into your reorder point.
A basic formula is:
Reorder Point = (Average Daily Demand × Average Lead Time) + Safety Stock
Using our earlier example:
- Average daily demand = 50 units
- Average lead time = 10 days
- Safety stock = 620 units
The reorder point would be:
(50 × 10) + 620 = 1,120 units
When available inventory reaches approximately 1,120 units, the replenishment process should be triggered.
Of course, a real-world inventory management strategy can be more complicated. Inventory may be spread across multiple fulfillment centers, inbound purchase orders may already be in transit, units may be allocated to existing orders, and expected demand may differ by location.
A capable inventory management software system should help account for these factors and provide visibility into available, committed, inbound, and on-hand inventory.
Reviewing and Adjusting Safety Stock Over Time
Safety stock shouldn't be a set-it-and-forget-it number.
Demand changes. Suppliers change. Transportation networks change. Promotions create spikes. New products mature, while older products decline.
Businesses should periodically recalculate safety stock and pay particular attention when:
- Demand changes significantly
- A SKU enters or exits a seasonal period
- Supplier performance changes
- Lead times increase or decrease
- A new promotion or product launch is planned
- A SKU experiences repeated stockouts
- Inventory repeatedly remains above target levels
Fast-moving or volatile SKUs may warrant more frequent reviews than stable products.
Exception reporting can make this process more manageable. Instead of manually reviewing every SKU, operations teams can focus on products exhibiting unusually high stockout frequency, inventory buildup, demand changes, or supplier delays.
Common Safety Stock Mistakes to Avoid
Even businesses with established inventory processes can undermine their safety stock strategy by relying on assumptions that no longer reflect reality.
Using outdated customer demand data. Historical demand is valuable only when it remains relevant. A product that has doubled in sales over the last six months shouldn't have safety stock based primarily on last year's average.
Applying the same method to every SKU. Fast movers, slow movers, seasonal products, high-margin products, and products with unreliable suppliers have different risk profiles. Segmenting SKUs can produce better inventory decisions.
Ignoring lead time variability. Average supplier lead time can hide significant swings. If a supplier sometimes delivers in 15 days and sometimes takes 30, planning around a 20-day average alone creates risk.
Confusing safety stock with excess inventory. Safety stock should have a purpose and be tied to measurable variability. Simply adding an arbitrary percentage to every purchase order can create unnecessary carrying costs.
Failing to account for seasonality. Average annual demand may dramatically understate the inventory required during peak periods and overstate what is needed during slower months.
Setting safety stock once and never revisiting it. Inventory behavior changes continuously. Safety stock calculations should change with it.

Better Inventory Decisions Start With Better Visibility
The best safety stock strategy isn't necessarily the one that puts the most inventory on the shelf. It's the one that gives your business enough protection against uncertainty while keeping inventory productive.
That requires accurate inventory data, visibility into demand, reliable lead-time information, and a disciplined process for reviewing and adjusting stock levels.
For brands working with a third-party logistics provider, inventory accuracy becomes especially important. Your 3PL's systems and processes should provide the visibility needed to understand what inventory is available, where it is located, and how it is moving through the fulfillment network.
At a2b Fulfillment, inventory management is an integral part of the fulfillment operation. Our technology, warehouse processes, and multi-node fulfillment capabilities help brands maintain inventory visibility while efficiently moving products from receiving through storage, order processing, and shipping.
The result is more than inventory sitting in a warehouse. It's an inventory and fulfillment operation designed to help brands make better decisions, respond to changing demand, and deliver consistently to their customers.
If inventory complexity is becoming an obstacle to growth, a2b Fulfillment can help you build a more scalable fulfillment operation.
Frequently Asked Questions
What is a safety stock calculation?
A safety stock calculation is a formula used to determine how much extra inventory a business should keep on hand to reduce the risk of stockouts. It creates a buffer against unexpected increases in demand, supplier delays, transportation disruptions, and other sources of variability.
How do you calculate safety stock?
Many businesses use the formula:
Safety Stock = (Maximum Daily Sales × Maximum Lead Time) − (Average Daily Sales × Average Lead Time)
This safety stock calculation estimates the buffer inventory needed to cover unexpected demand increases or supplier delays without simply maintaining excessive inventory.
Why is safety stock important for eCommerce fulfillment?
Safety stock helps prevent missed sales, backorders, and customer dissatisfaction caused by stockouts. Maintaining an appropriate inventory buffer helps brands continue fulfilling orders when demand exceeds forecasts or replenishment takes longer than expected.
Is safety stock the same as a reorder point?
No. Safety stock is the additional inventory maintained as a buffer against uncertainty. A reorder point is the inventory level at which replenishment should be triggered. Safety stock is typically included when calculating the reorder point:
Reorder Point = (Average Daily Demand × Average Lead Time) + Safety Stock
How often should safety stock be recalculated?
There is no universal schedule, but businesses should review safety stock regularly and whenever demand patterns, supplier reliability, lead times, seasonality, or product lifecycle conditions change. High-volume and highly variable SKUs generally benefit from more frequent review.